Dynamic Causal Governance

Explore DCGI

Structural case · Logistics · Retrospective

The ship was local. The dependency was global.

A structural causal analysis of the 2021 Ever Given grounding. The visible event was a ship blocking a canal. The consequential event was the temporary collapse of a highly concentrated global dependency structure.

6 days canal obstructed, 23–29 March 2021 422 vessels waiting when traffic resumed ~12% of global trade routed through the corridor
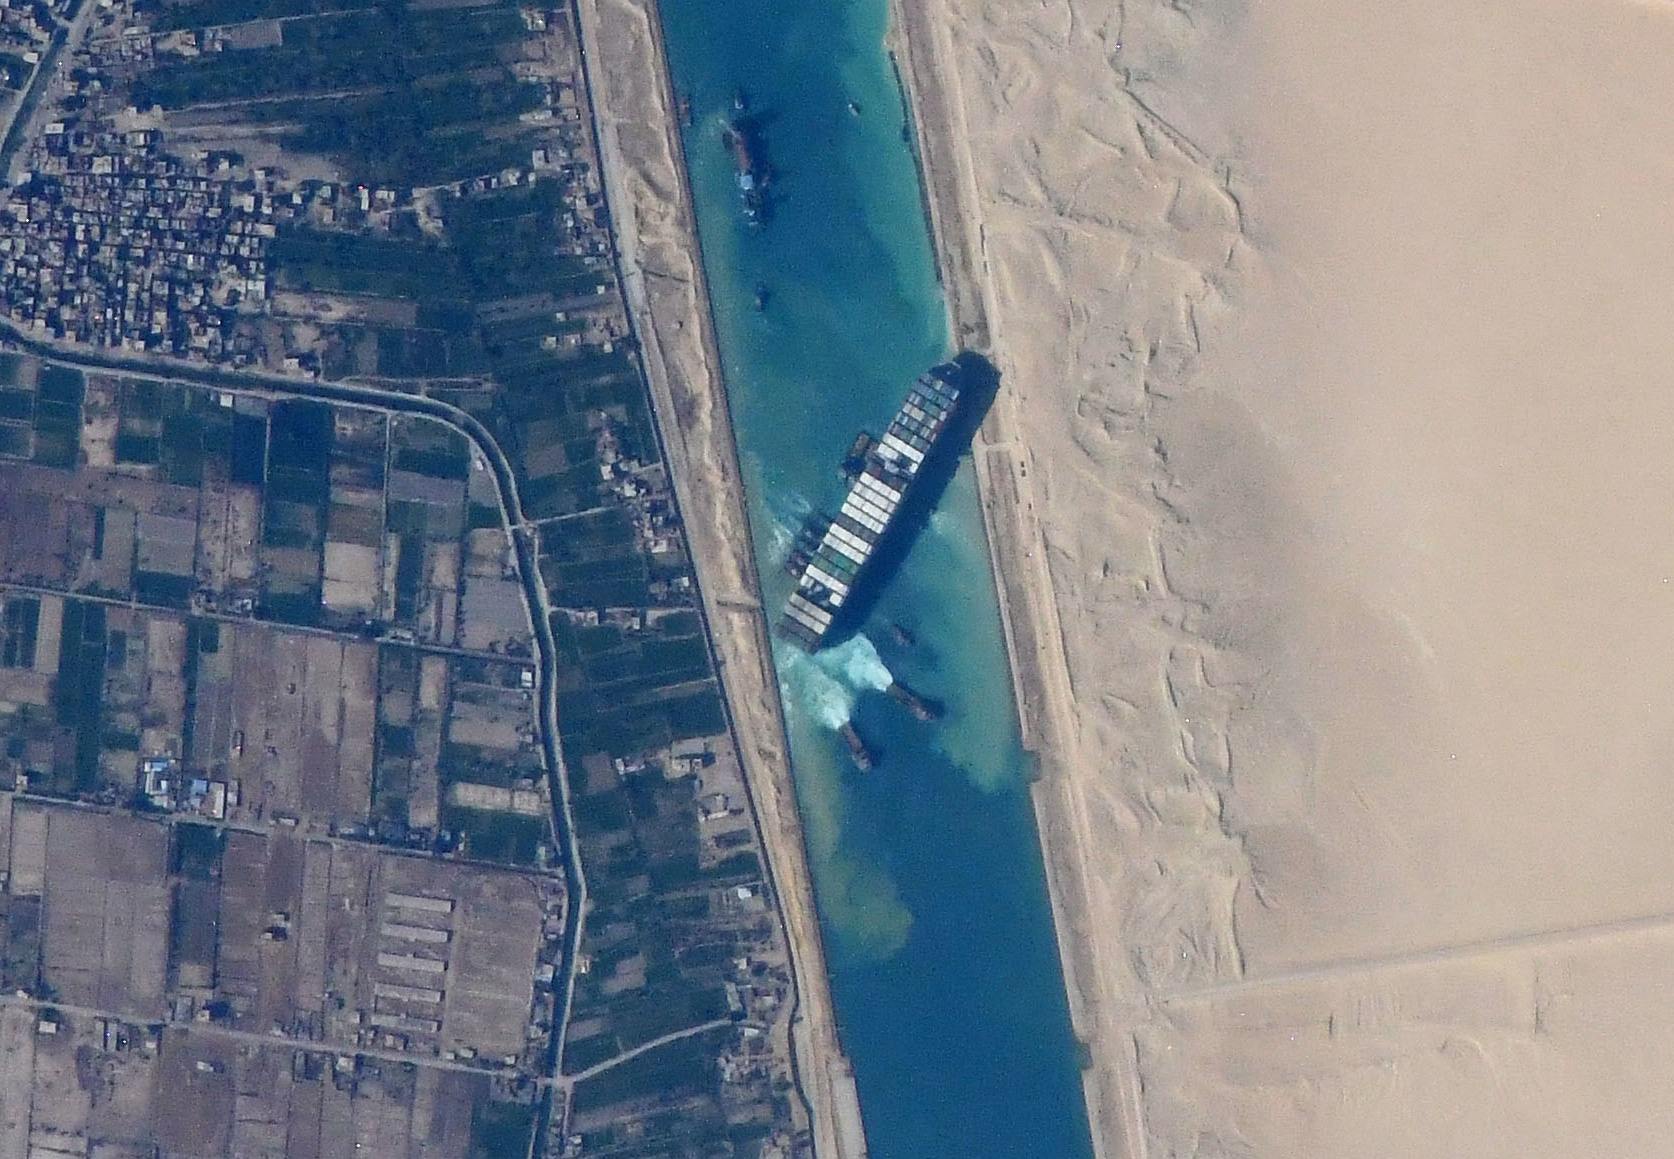
The container ship Ever Given wedged diagonally across the Suez Canal, photographed from the International Space Station on 27 March 2021.
Ever Given · Suez Canal · 27 March 2021 NASA JSC ISS image library · Public domain

The executive thesis

On 23 March 2021 the Ever Given, a roughly 400-metre container vessel of about 20,000 TEU capacity, grounded in the southern section of the Suez Canal. It remained lodged across the channel until 29 March.

The immediate event was local: one vessel, one navigational failure, one blocked channel. The consequential event was not. Zero corridor capacity produced hundreds of delayed vessels, disrupted schedules, port congestion, container displacement, inventory delays, freight-rate pressure, commodity volatility, additional emissions, insurance claims, legal disputes and a geopolitical reassessment of maritime chokepoints.

The Ever Given did not create the vulnerability. It activated it.

The vulnerability already existed in the architecture of global trade: traffic concentrated through a small number of maritime chokepoints, growing dependence on mega-container ships, single-lane sections with limited recovery options, highly synchronised shipping networks, low-buffer supply chains, container and port systems already stressed by COVID-19, weak redundancy between alternative routes, fragmented operational and legal responsibility — and an economy optimised for throughput efficiency rather than disturbance absorption.

The International Transport Forum had warned years earlier that mega-ships generate economies of scale for carriers while simultaneously creating larger traffic peaks, higher infrastructure requirements, greater cargo concentration and increased supply-chain risk. The Ever Given was therefore not merely an accident. It was a structural stress test.

How this case reads the event

Five categories that must not collapse into one another.

Most post-incident analysis fails here: it explains the accident and calls that an explanation of the consequence. They are different causal chains.

Trigger

The event that initiates the observed failure sequence.

Direct effect

Consequence produced through very few causal transitions.

Indirect effect

Consequence requiring propagation through other systems or domains.

Counterintuitive effect

A consequence that contradicts the expected direction of an action or intervention.

Structural problem

A pre-existing configuration that lets a local disturbance become disproportionately consequential.

Trigger ≠ root vulnerability Event ≠ structure Exposure ≠ loss Node recovered ≠ system recovered
Ground truth

It was not simply that a sandstorm pushed the ship sideways.

The Panama Maritime Authority casualty investigation found no navigational or mechanical deficiency that explains the casualty. The grounding emerged from a combination of conditions, geometry, control decisions and governance failures — several of which were individually recoverable.

01

Meteorological

Wind direction and intensity changed substantially during the critical period, with recorded speeds reaching about 13.9 m/s against an enormous wind-exposed surface.

02

Hydrodynamic

Squat, bank suction and bank cushion in a comparatively narrow, shallow channel. The effect becomes nonlinear as the vessel moves off the centreline.

03

Control

Large hard-over helm commands with few intermediate rudder orders, no consistently stated course to steer, and speed above the canal's roughly 8.64-knot limit.

04

Communication

Discussions between the pilots took place in Arabic, limiting situational understanding for the rest of the bridge team.

05

Preventive risk

Weather conditions were inadequately evaluated, preventive tug assistance was not used, and postponing the transit was an available option.

06

Authority

Formal command rested with the Master while navigation was effectively directed by the pilots. Command was not reasserted once navigation became uncontrolled.

Root cause as stated by the flag-state investigation: loss of manoeuvrability — itself an intermediate state, not the deepest cause.

The counterintuitive mechanism at the centre of the accident

Increasing speed improves rudder effectiveness. Faced with deteriorating directional control, increasing power is a locally rational response: more water flow over the rudder means more steering authority.

But inside a constrained channel, increasing speed also strengthens squat and bank effects — the very mechanism producing the instability. The same action pushed the system in both directions at once.

A locally rational corrective action can become globally destabilising because its effect changes with the state of the system.

A second inversion appeared on the bridge. Two pilots were aboard, and the investigation notes this may have led the Master to believe there was greater control over the developing situation than there was. More expertise present produced more perceived safety, more deference and less independent intervention. Redundancy in personnel did not produce redundancy in decision-making.

The transition that matters

Not ship moving to ship grounded. One grounded ship to a corridor at zero throughput.

This is where a maritime accident becomes a consequential problem. A system whose capacity is concentrated through one narrow corridor does not degrade gradually — it exhibits a discontinuity.

99% clear ≈ operational 50% clear ≠ 50% capacity Vessel across the channel = near 0% usable capacity

Suez sits on one of the shortest maritime paths connecting Asian production to European and Mediterranean markets. Many independent supply chains shared the same hidden dependency: their products were unrelated, their causal infrastructure was not.

Propagation

The disturbance changed terrain repeatedly.

Weather to hydrodynamics to navigation to infrastructure to logistics to production to markets to law to geopolitics. Each transition is a different causal regime with different actors, different clocks and different recovery mechanisms.

Causal terrainPropagationPrincipal consequence
HydrodynamicConfined water and a very large vesselNonlinear yaw, loss of control
InfrastructureShip spans a single-lane segmentCorridor capacity collapse
Maritime networkArrival rate exceeds departure rateHundreds of vessels queued
RoutingCape of Good Hope diversionLonger voyages, more fuel
FleetVessel rotations extendedLower effective fleet capacity
Container networkBoxes remain aboard longerEquipment shortage elsewhere
PortsBacklog released as a pulseArrival bunching, secondary congestion
ManufacturingInputs arrive late into low-buffer linesJust-in-time exposure
Modal networkEmergency demand for air and railCapacity scarcity in another mode
Freight marketEffective shipping capacity fallsSpot rates rise
CommoditiesTransit uncertainty enters expectationsPrice volatility, not a simple rise
EnvironmentalLonger journeys burn more fuelAdditional emissions
InsuranceSalvage expenditure sharedGeneral Average liability distributed
LegalCompensation dispute, vessel detainedCargo delayed months after reopening
HumanitarianLivestock vessels held in the queueWelfare risk with no contingency plan
SecurityChokepoint vulnerability demonstrated publiclyStrategic reassessment
PolicyPolitical attention converted to investmentCanal widened and deepened
Counterintuitive effects

Where the system moved against expectation.

These are the findings a linear reading of the event cannot produce, and the reason a structural reading is worth the effort.

C1

Reopening created a second bottleneck

The obstruction created a stock. Removing it converted that stock into a pulse: synchronised arrivals, terminal congestion, longer dwell times. Rotterdam processed a delayed group it called the “Suez Armada” — 64 container vessels bound for the port.

C2

Rerouting sometimes bought no time

Because the blockage was resolved comparatively quickly, some vessels that sailed around the Cape arrived at roughly the time waiting would have produced — after burning substantially more fuel.

C3

Undamaged cargo still generated liability

The owner declared General Average. Cargo interests can be required to contribute to extraordinary preservation costs even when their own goods were never damaged. Propagation created by legal architecture, not by physics.

C4

The canal reopened; the cargo did not move

The vessel was detained in the Great Bitter Lake during compensation negotiations and only reached Rotterdam on 29 July 2021 — four months after grounding. Physical recovery preceded legal recovery.

C5

Disruption produced winners as well as losers

Scarce shipping capacity raised freight rates. Cargo owners absorbed cost; some carriers recorded higher revenue. System outcome and actor outcome are not the same measurement.

C6

The largest cost was time, not distance

A peer-reviewed analysis of one carrier’s affected network modelled about $88.79M in additional cost — of which roughly $76.29M was inventory-carrying cost rather than vessel operating cost.

C7

Oil did not simply rise

Brent rose almost 6% on 24 March on supply-risk expectations, then fell while the canal was still blocked as pandemic demand concerns dominated. The observed price was a field of competing forces, not a response to the canal alone.

C8

Resilience action created an externality

Avoiding the blockage meant longer routes. One modelled estimate puts the additional emissions from waiting and rerouting at about 44,574 tonnes of CO₂ for a single carrier’s affected fleet.

C9

Efficiency was the vulnerability

Mega-ships, concentrated routes, high asset utilisation, low inventory and synchronised schedules produce cheap global trade. The same properties raise propagation potential.

Structural problems exposed

What the event revealed about the architecture, not the accident.

SP-1

Chokepoint concentration

High flow plus low route redundancy equals high consequential centrality.

SP-2

Ship–infrastructure asymmetry

Vessel scale grew faster than the channels, salvage capability and recovery systems that must absorb its failure.

SP-3

Recovery did not scale with scale

Cargo concentration rose sharply. Rapid salvage capacity did not rise proportionally.

SP-4

Redundancy was prohibitively expensive

The alternative to Suez was not a parallel route. It was sailing around Africa.

SP-5

Local optimisation, systemic externality

The actors capturing the efficiency gains are not the actors absorbing the systemic cost.

SP-6

Authority misalignment

Normal operation tolerates ambiguity between formal and practical command. Abnormal operation does not.

SP-7

Static permission, not dynamic gating

The question answered was whether the ship could transit. The question needed was whether this ship, in this wind, at this draft, with this tug availability, could transit now.

SP-8

Shared hidden dependencies

Industry classification hid causal topology. Unrelated sectors shared one corridor.

SP-9

Buffers removed with the inventory

Just-in-time reduced excess stock and, with it, the ability to absorb temporal disturbance.

SP-10

Intertemporal container coupling

Delaying cargo delays the equipment needed for cargo that does not yet exist.

SP-11

Fragmented responsibility

Japanese ownership, Taiwanese operation, German technical management, Panama flag, Egyptian canal authority, international cargo owners and multiple insurers — integrated in operation, fragmented in accountability.

SP-12

No cross-terrain contingency

Every domain planned for its own incident. The disturbance moved through all of them. The livestock scenario had effectively not been anticipated at all.

Recovery

System recovery is not an event. It is a propagation process.

A naïve metric says the vessel was refloated, therefore the system recovered. The system in fact carried nine unsynchronised clocks.

T1 Vessel refloated T2 Canal reopened T3 Queue cleared T4 Schedules normalised T5 Port backlog absorbed T6 Containers repositioned T7 Inventory pipelines restored T8 Vessel released legally T9 Cargo delivered

Restoring the initiating node is not the same as restoring the system it disturbed.

Feedback structure

The loops that carried the disturbance.

R1 · Hydrodynamic instability

Off-centre reinforces itself

Off-centre position produces bank effects, which produce yaw, which produces a corrective manoeuvre, which overshoots, which increases the off-centre position.

R2 · Logistics capacity

Delay reduces the capacity that absorbs delay

Delay extends vessel rotation, which lowers effective capacity, which produces congestion, which produces further delay.

R3 · Container scarcity

Boxes trapped where they are not needed

Delay leaves containers unavailable at origin, reducing bookings and disrupting repositioning, which delays the next cycle.

R4 · Port congestion

Bunching feeds on itself

Arrival bunching creates terminal congestion, which raises dwell time, which slows evacuation, which deepens congestion.

B1 · Cape diversion

Balancing locally, reinforcing elsewhere

Rerouting avoids queue exposure but lengthens voyages, which reduces fleet availability — feeding R2.

B2 · Emergency air freight

Balancing locally, destabilising another market

Air substitution protects a production line but consumes scarce capacity, raising prices in a mode already tight.

Structural leverage

Interventions sit at very different causal depths.

Some prevent the trigger. Some raise recovery capacity. Some change what a disturbance can reach. They are not substitutes for one another.

InterventionLayerExpected effect
Weather-based transit gatingTriggerPrevent exposure
Mandatory tug support under defined conditionsRecoveryIncrease manoeuvrability margin
Dynamic speed envelopeControlAvoid unstable hydrodynamic regimes
Explicit Master intervention thresholdsGovernanceRemove authority ambiguity
Wider and deeper channel geometryInfrastructureIncrease physical tolerance
Additional parallel navigation sectionsNetworkReduce binary capacity failure
Sequenced release after reopeningNetworkReduce destination pulses
Distributed inventory buffersSupply chainAbsorb delay
Container visibility and repositioningLogisticsReduce secondary equipment shortage
Cross-domain contingency planningGovernanceAnticipate propagation, not incidents
Structural-dependency mappingStrategicReveal hidden common-mode exposure

Egypt subsequently widened and deepened the southern sector and extended the two-way section, explicitly citing the incident. The consequence altered the structure that had helped produce it.

The core conclusion

Traditional accident analysis asks why the Ever Given ran aground. That question produces wind, speed, pilot behaviour and hydrodynamics. It is necessary, and it is not sufficient.

The structural question is different: why was one ship capable of temporarily reorganising global logistics? That question produces centrality, concentration, dependency, buffering, redundancy, coupling, recovery capacity and topology — and it is the one that explains the consequence.

The Ever Given was not globally consequential because the accident was extraordinary. It was globally consequential because an ordinary class of failure intersected an extraordinary concentration of dependency.

The decisive variable was not the magnitude of the initiating disturbance. Consequentiality scaled with structural centrality, coupling, fragility and propagation reach, divided by the system’s absorptive capacity. Without the first causal chain there is no accident. Without the second there is no global crisis.

A local event becomes a consequential problem when it intersects a structure capable of propagating it.

Evidence base and limits

What this case can and cannot establish.

Observed

Grounding on 23 March 2021 and refloating on 29 March 2021; vessel dimensions; canal geometry; detention and eventual release of the vessel on 29 July 2021.

Investigated

Contributing factors, wind data, speed relative to the canal limit, helm command pattern and bridge communication, as reported by the Panama Maritime Authority casualty investigation.

Reported

422 vessels waiting at reopening (Suez Canal Authority); 64 delayed vessels bound for Rotterdam; 16 EU livestock vessels affected (European Parliament study).

Estimated

Roughly $9.6bn of trade held per day (Lloyd’s List) and about $92.7bn of cargo exposed across 432 vessels are flow and exposure figures, not realised economic loss. Emission and cost figures are modelled for one carrier’s network.

Not established

This case does not attribute blame, quantify total global economic loss, or claim the counterfactual without the grounding is known. The counterintuitive effects are structural readings of reported outcomes, not controlled findings.

Scope

Retrospective structural analysis. It demonstrates explanatory power over a documented event; it does not constitute predictive validation of the method.